Building a dedicated app and data dashboard to accurately record and analyse valuable citizen science river data.
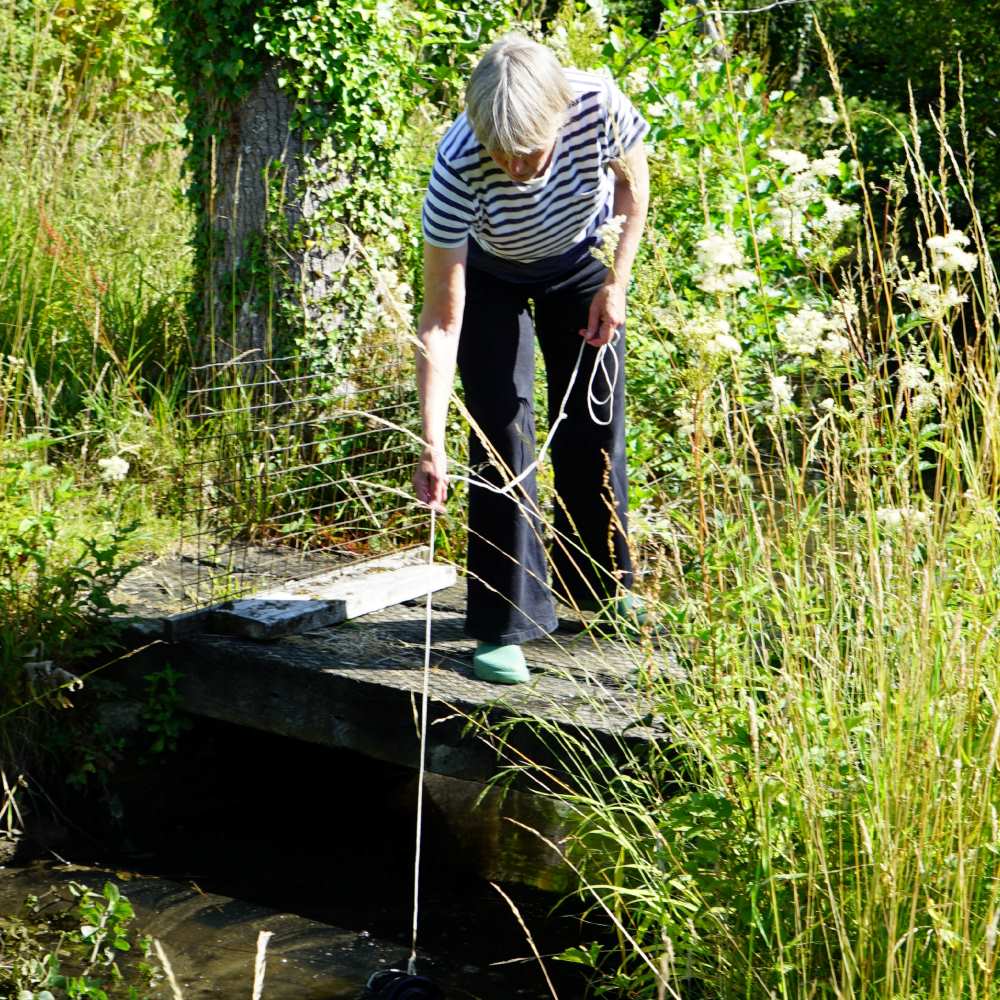
Our dedicated citizen scientists were collecting weekly water quality samples in the River Wensum Catchment, but the existing recording process led to data errors, often from accidental mistyping or locational inaccuracies. This required time-intensive "cleaning" before any analysis could be done, slowing down the process of turning raw data into actionable insights.
We developed a new mobile app and data portal over six months, incorporating extensive volunteer feedback.
The app, built using ESRI Survey123, is designed to prevent errors by pre-populating fields, setting parameter ranges and auto-filling locational data. For maximum efficiency, it's split into four sections, including a “pollution trigger” that automatically sends an emergency email and a photo report directly to the local Environment Agency (EA) Land & Water team. Crucially, comprehensive volunteer training is provided to ensure accurate data collection from day one.
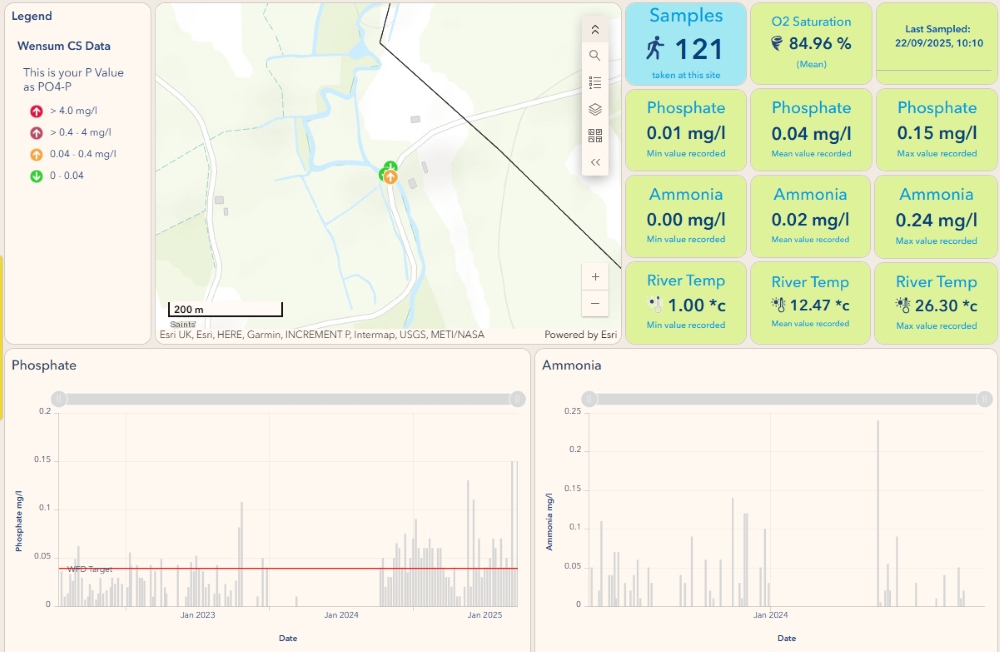
The data portal, 'The Anglian Data Dashboard,' was built using ESRI ArcOnline, providing four ways to view the collected river data.
The app upgrade has transformed citizen science monitoring, allowing water quality data to be gathered uniformly and submitted instantly to a central dashboard.
The dashboard's four key viewing options facilitate data analysis and can be accessed by the volunteers and stakeholders:
Site dashboard: Helps volunteers monitor how a specific location changes over time, acting as an early warning for rising pollution. It can even help distinguish between pollution from a single source and issues caused by low water flow.
Catchment dashboard: Provides a vital big-picture view of trends across all sites in a river system. This has shown that impacts near the river's source are often missed by traditional agency monitoring downstream.
Site compare dashboard: Allows users to easily compare data across different locations. Values over the safe limit are highlighted in red, which quickly shows how a watercourse is affected by events and pressures.
Photo gallery app: A powerful visual record of changes in water colour, sediment load and habitat that helps stakeholders quickly understand where interventions are most needed.
Importantly, these tools ensure that stakeholders and policymakers can make the most of the vital information collected by committed volunteers.
The dashboard was specifically designed to be easily adopted by other catchment partnerships and groups nationwide. To find out more or ask for a demonstration, please email data@norfolkriverstrust.org
This process was part of the wider Catchment Systems Thinking Cooperative (CaSTCo) project, which received funding from The Ofwat Innovation Fund. Additionally, we received funding from Anglian Water to develop the data platform and an associated technical manual.
We use Mailchimp as our marketing platform. By clicking subscribe, you acknowledge that your information will be transferred to Mailchimp for processing. Learn more about Mailchimp's privacy practices here.


.jpg)
.jpg)


.jpg)